
Table of contents
2 – Points of measure: define how every number is taken
3 – Building the chart: base size, grade, and tolerance
4 – How the workshop uses your size chart
5 – Where size charts go wrong
6 – Building your size chart with a production partner
7 – Frequently asked questions
TL;DR — A grading size chart tells a workshop the exact finished measurements of your garment in every size. It is not the size guide on your website: it records garment measurements, not body measurements. A usable chart defines how each measurement is taken, starts from a base size, shows how much each measurement changes per size, and sets a tolerance for each one. It lives in your tech pack, and the workshop uses it both to build the garment and to check it.
A grading size chart is one of the shortest documents in a tech pack, and one of the most consequential. It’s a table of numbers. But those numbers decide whether your garment fits the people you designed it for, in every size you sell.
Most brands underestimate it. They send the size guide from their website, or a chart borrowed from another brand, and assume the workshop will work out the rest. The workshop will. It just won’t know what you had in mind, so it will fill the gaps with its own defaults.
This guide shows how to build a size chart a workshop can actually produce from: what to measure, how to define each measurement, how to grade it across sizes, and how to set tolerances. It’s one step in the full clothing production process, and if you’d rather hand it to a team that builds these every week, a made in Italy clothing manufacturer can develop it with you.
Body measurements vs garment measurements
Start with the distinction that causes the most expensive mistakes. There are two kinds of size chart, and they contain completely different numbers.
- A body measurement chart describes the customer. It says a size medium fits someone with a certain chest, waist, and hip. It’s what belongs on your website, to help people choose a size.
- A garment measurement chart describes the product. It records the finished dimensions of the garment itself, measured on the garment. It’s what the workshop needs to build to.
The gap between the two is called ease: the extra room a garment has beyond the body inside it. And ease isn’t a technical detail. It’s a design decision. It’s what makes the same size medium a slim shirt, a regular one, or an oversized one.
For example, let’s say your size medium customer has a 96 cm chest. A slim-fit shirt for that customer might measure around 102 cm at the chest. A relaxed fit might measure 112 cm or more. Same customer, same size label, very different garment. The body chart can’t tell the workshop which one you want. Only the garment chart can.
So when a brand sends body measurements to a workshop, it hands over the fit decision without realising it. The workshop adds whatever ease it considers standard, and the fit you get is theirs, not yours.
Build your production chart in garment measurements. If you only have body measurements so far, that’s a starting point, but decide the ease for each measurement before the chart goes to the workshop. The simplest way to do that is to measure a garment that already fits the way you want.
Points of measure: define how every number is taken
A size chart that says “chest: 52” looks precise. It isn’t. Where on the garment? Straight across, or following the curve? Half the chest, or the full circumference? Two people can measure the same shirt and write down different numbers, both honestly.
That’s why every measurement in a production chart needs a definition, known as a point of measure. It states exactly where the measurement starts, where it ends, and how the garment lies while you take it.
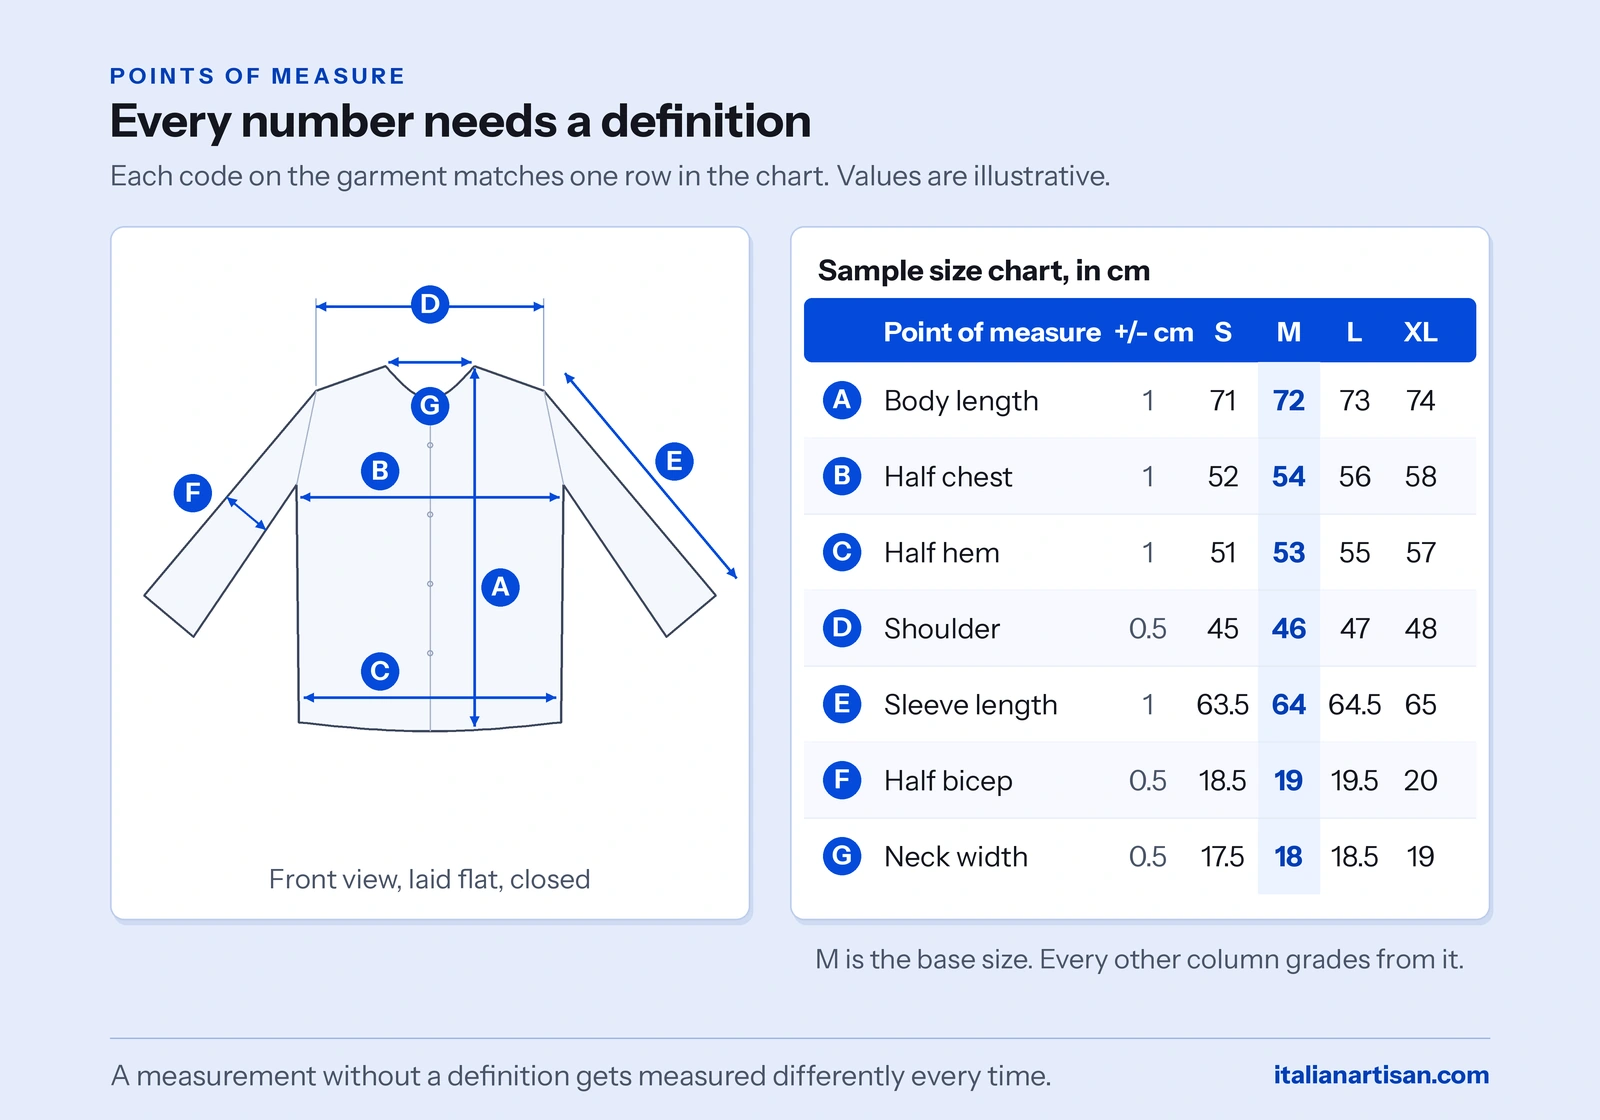
A few rules make any chart readable.
- Measure the garment flat. Lay it on a table, smooth but not stretched, buttoned or zipped closed.
- Say whether a width is half or full. Most workshops measure flat widths edge to edge, which gives half the circumference. Write “half chest” or “chest circumference” so nobody doubles or halves your numbers by mistake.
- Anchor lengths to a fixed point. Body length usually runs from the high point of the shoulder, where the shoulder seam meets the collar, straight down to the hem.
- Fix widths at a set height. Chest, for example, is commonly measured 2.5 cm below the armhole. Without that detail, the chest measurement moves every time someone measures.
- Give each point a code. A, B, C, and so on, matching a diagram. Then comments like “B is 1 cm too narrow on the sample” can’t be misread.
The essential points for a top
For a shirt, T-shirt, or knit top, these cover most of what a workshop needs.
- Body length: from the high point of the shoulder to the hem.
- Chest: straight across, 2.5 cm below the armhole.
- Waist: straight across at the narrowest point, or at a set distance from the shoulder.
- Hem width: straight across the bottom edge.
- Shoulder width: from shoulder point to shoulder point, across the back.
- Sleeve length: from the shoulder point to the end of the cuff.
- Bicep: across the sleeve, 2.5 cm below the armhole.
- Cuff or sleeve opening: across the end of the sleeve.
- Neck width and front neck drop: the opening across, and how deep it sits below the shoulder line.
The essential points for trousers
Trousers follow the same logic with their own reference points.
- Waist: across the top of the waistband, closed.
- Hip: across the widest point, at a set distance below the waistband.
- Front rise and back rise: from the crotch seam to the top of the waistband, front and back separately.
- Inseam: from the crotch to the hem, along the inside leg.
- Thigh, knee, and leg opening: across the leg at set heights, and at the hem.
Keep the list to what matters for your garment. A size chart with forty points nobody checks is less useful than one with twelve that everyone does.
Building the chart: base size, grade, and tolerance
With the points of measure defined, the chart itself is straightforward. Each row is one point of measure. The columns hold its code and definition, its tolerance, and a measurement for every size.
Here’s what a production chart for a shirt looks like. The values are illustrative, to show the structure. Your own come from your base size and your fit.
| Code | Point of measure (cm) | Tol. ± | S | M (base) | L | XL |
|---|---|---|---|---|---|---|
| A | Body length, from high point of shoulder | 1 | 71 | 72 | 73 | 74 |
| B | Half chest, 2.5 cm below armhole | 1 | 52 | 54 | 56 | 58 |
| C | Half hem width | 1 | 51 | 53 | 55 | 57 |
| D | Shoulder width | 0.5 | 45 | 46 | 47 | 48 |
| E | Sleeve length, from shoulder point | 1 | 63.5 | 64 | 64.5 | 65 |
| F | Half bicep, 2.5 cm below armhole | 0.5 | 18.5 | 19 | 19.5 | 20 |
| G | Neck width | 0.5 | 17.5 | 18 | 18.5 | 19 |
Start from the base size
Fill in the base size first. It’s the size the pattern was developed and fitted in, usually one in the middle of your range, and every other column derives from it. If you’re working from a reference garment, these are the numbers you measure off it.
Get the base right before you touch the other sizes. Every error in the base column travels into every size you grade from it.
Check the steps between sizes
Read across each row and look at how much the measurement changes from one size to the next. That step is the grade, and it should be deliberate.
Consistent steps are the first thing to check. If the half chest grows by 2 cm from S to M but by 3 cm from L to XL, either the jump is intended or someone made a typing mistake. Catch it on paper, not on a sample.
Then check that the steps differ by point. Chest and hem move most, shoulder and length less, neck and bicep least. That’s how bodies change between sizes, and a chart where every measurement grows by the same amount is a warning sign.
Set a tolerance for every measurement
No workshop can hit a measurement to the millimetre on every piece. Fabric stretches, shrinks, and moves under the needle. The tolerance states how far a finished garment can deviate from the chart and still count as correct.
Tolerances matter more than they look, because they’re what quality control measures against. Without them, every deviation becomes an argument. With them, a garment either falls inside the range or it doesn’t.
- Larger measurements, like body length and chest, usually carry tolerances around ±1 cm.
- Smaller or more visible ones, like neck width, shoulder, and cuff, usually need tighter tolerances, around ±0.5 cm.
- Knits and stretch fabrics often need wider tolerances than woven cloth, because they move more.
Set tolerances that match what actually matters to your fit. Very tight tolerances everywhere make production slower and rejects more frequent, which shows up in the price. And agree them before production starts, not after the first delivery arrives.
How the workshop uses your size chart
A size chart isn’t a document you send once and forget. It follows the garment through every stage after it, and at each stage someone measures against it.
- Pattern making and grading: the pattern maker builds the base pattern to your base column, and grades the other sizes to your grade column.
- Sampling: every sample gets measured point by point against the chart. Differences get logged by code, so “B is 1.5 cm over” means the same thing to everyone.
- The size set: once the base sample is right, samples in the other sizes show whether the grade holds across the range.
- Quality control: during and after production, inspectors measure finished pieces against the chart and the tolerances. It’s the reference that decides whether a garment passes.
Which means the chart has to stay current. When a fit session changes a measurement, update the chart, give it a new version number, and send the new version to everyone involved. One of the most common problems we see in development is a change agreed on a call that never makes it into the document. The sample then comes back built to the old version, and a round of sampling goes to waste.
Where size charts go wrong
Most size chart problems are simple, and most of them are avoidable before the chart ever reaches a workshop.
- Body measurements instead of garment measurements. The workshop then decides your ease, and with it your fit.
- Numbers without definitions. A measurement without a point of measure gets taken a different way by every person who checks it.
- Half and full measurements mixed. A half chest read as a full circumference produces a garment half the intended width, or twice it.
- Mixed units. Italian workshops work in centimetres. If your team thinks in inches, convert the whole chart and state the unit at the top. Never mix the two in one document.
- A chart copied from another brand. Their measurements fit their customer. Yours may be built differently.
- No tolerances. Without them, quality control has no standard, and every deviation turns into a negotiation.
- An outdated version. Corrections agreed in fittings that never make it back into the chart.
None of these needs specialist knowledge to prevent. They need a checklist, a consistent format, and the discipline to update the document every time something changes.
The Size Chart Template
A ready-to-fill production size chart: points of measure with space for definitions, tolerances, and columns for every size. Print it, fill it from your base garment, and send it with your tech pack.
Download the template (PDF)Building your size chart with a production partner
You can build a production size chart yourself, and the steps above are the way to do it. But the hardest part isn’t filling in the table. It’s deciding the right numbers: how much ease your fit needs, which tolerances matter for your garment, and how each measurement should step across your range.
That judgment comes from building charts for many garments, and from seeing what happens when those charts meet a workshop. In our process, the size chart gets developed as part of the tech pack, often from a reference garment you already like, and a production manager reviews it before it reaches the workshop. Every change agreed in a fitting goes back into the chart as a new version, and quality control measures the finished run against the same tolerances.
That’s how we treat the size chart when manufacturing clothing in Italy: as the reference that connects your design, the workshop, and the final check.
Get a size chart your workshop can build to
Send us your sketches, your current measurements, or a garment that fits the way you want. We’ll turn them into a production size chart and manage it through sampling and quality control.
- Garment measurements, not guesses — ease decided by you, not by a workshop default
- Defined points and tolerances — so every sample and every piece gets measured the same way
- One current version — every fitting change recorded and shared before the next sample
Frequently asked questions
What is a grading size chart?
It’s the table in your tech pack that gives the finished measurements of a garment in every size. Each row is a point of measure with a definition and a tolerance, and each column is a size, starting from the base size the pattern was developed in.
What is the difference between a size chart and a size guide?
A size guide describes the customer’s body and helps shoppers choose a size. A production size chart describes the finished garment and tells the workshop what to build. The difference between them is the ease, which is a design decision about fit.
What measurements should a size chart include?
The points that define fit for your garment. For a top: body length, chest, waist, hem, shoulder, sleeve length, bicep, cuff, and neck. For trousers: waist, hip, front and back rise, inseam, thigh, knee, and leg opening. Each needs a written definition of how it’s taken.
What tolerance should I set?
Around ±1 cm is common for larger measurements like length and chest, and around ±0.5 cm for smaller or more visible ones like neck, shoulder, and cuff. Knits often need wider tolerances. Set them by what matters to your fit, since very tight tolerances raise cost and rejects.
Should my size chart be in centimetres or inches?
Italian workshops work in centimetres, so a chart in centimetres avoids conversion errors. If your team works in inches, convert the whole chart and state the unit at the top. Never mix the two in one document.
Can I build a size chart from an existing garment?
Yes, and it’s often the fastest way to capture a fit you already like. Lay the garment flat, measure each point using a consistent definition, and use those numbers as your base size. Then decide the steps to the other sizes.